List of selected recent publications
New fault slip distribution for the 2010 Mw 7.2 El Mayor Cucapah earthquake based on realistic 3D finite element inversions of coseismic displacements using space geodetic data
In this work we investigate the 4 April, 2010, Mw 7.2 El Mayor-Cucapah (EMC) earthquake. Existing studies modeled the EMC area as an elastic half-space in a homogeneous or vertically layered structure, which, along with differences in data and inversion methodologies, led to considerable variability in the resultant fault slip models. To investigate the EMC earthquake more realistically, we first examine how published coseismic fault slip models have approached the problem and what are their findings, then we select the optimal geometry and slip of one most recent and comprehensive coseismic fault slip model, obtained through analytical inversions, and adapt them in a threedimensional finite element numerical environment where we assess the effects of topography and material heterogeneities. Numerically optimized slip models are obtained via joint inversion of GPS, interferometric synthetic aperture radar and subpixel offset datasets. We find the effect of topography to be negligible while the inclusion of material heterogeneities enhances the slip at depth, as might be expected where the medium has higher rigidity, and better fits the displacements at both near and far field. Our findings suggest that the EMC earthquake was associated with a higher and more spatially concentrated slip than previously thought implying a greater stress drop at depth.
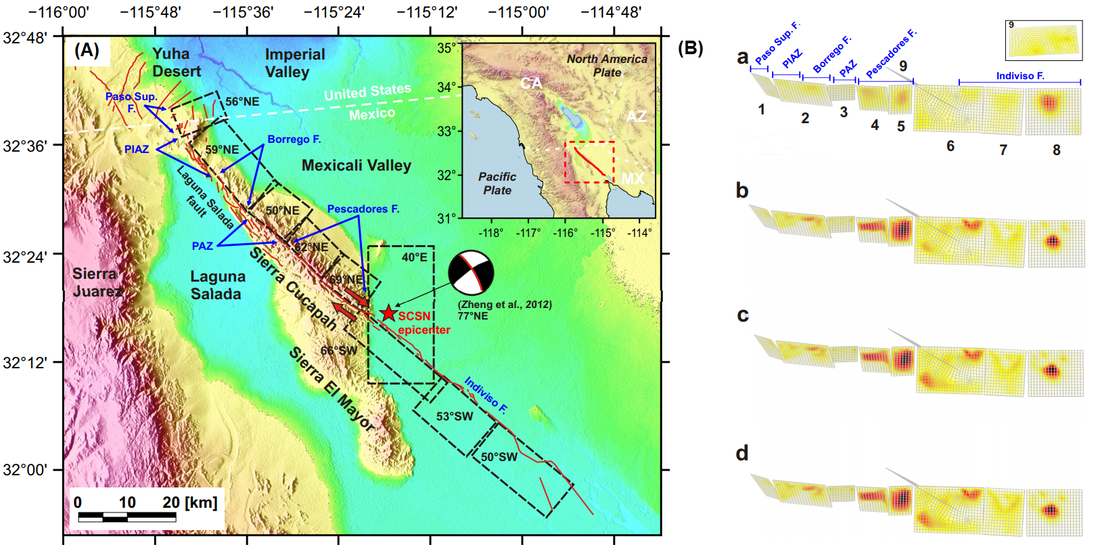
Figure. (A) Map of the epicentral region of the El Mayor-Cucapah earthquake. Black dashed fault plane outlines represent the geometry from Huang et al., 2017. Red line represents the actual fault trace while the positions of the actual fault segments are reported in blue. Red star is the epicenter location based on the Southern California Seismic Network (SCSN) catalog. In the inset, the tectonic overview of Southern California and Baja California including the Pacific–North America plate boundary and the California, Arizona and Mexico borders. (B) Slip distributions. a) Huang et al., 2017 solution with plane 9 in the inset; b) Optimized solution in the homogeneous case; c) Optimized solution in the layered case; d) Optimized solution in the heterogeneous case). Inset is excluded from b, c and d as it is the same of a. Actual fault names and positions are shown in blue.
Pulvirenti F., Liu Z., Lundgren P., Gonzalez-Ortega J.A. and Aloisi M. (2020). New fault slip distribution for the 2010 Mw 7.2 El Mayor Cucapah earthquake based on realistic 3D finite element inversions of coseismic displacements using space geodetic data. J. Geophys. Res. doi: 10.1029/2020JB020016.
Application of satellite SAR interferometry for the detection and monitoring of landslides along the Tijuana - Ensenada Scenic Highway, Baja California, Mexico
Here we investigate the potential of satellite interferometric SAR techniques, such as conventional DInSAR and Advanced DInSAR (IPTA approach), for landslide identification and characterization along the Salsipuedes section of Tijuana-Ensenada Scenic Highway (TESH) on the northwestern coast of Baja California, from the 2003–2010 period. The obtained results showed that, despite the limitations of the techniques, they could be effectively used for the slope displacements detection and monitoring. Based on the results of the interferometric processing, six landslides that have been active during the study period were identified, their geometric parameters were obtained, and their displacement rates were quantified. The landslides were classified as very slow based on measured LOS displacement rates (up to 5.5 cm/ yr).
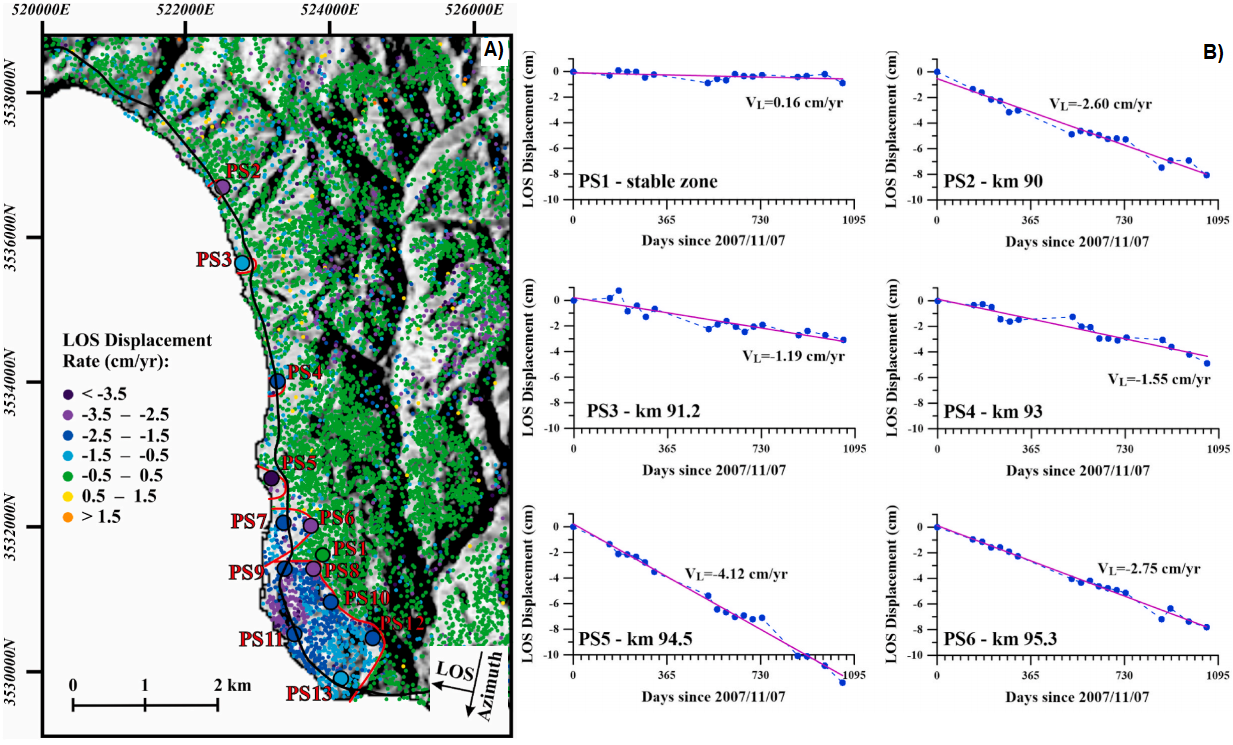
Figure. A) Map of average linear LOS displacement rate (cm/yr) obtained from ENVISAT ASAR images descending orbital pass acquired between 2007 and 2010. The negative displacement values indicate a movement away from the sensor; the positive displacement values indicate a movement towards the sensor. The red lines contour the active landslides determined based on the results of conventional DInSAR. PS indicate Permanent Scatter sites. B) The values indicated are temporally relative to November 2007 and spatially relative to a reference point. The displacement is in LOS direction; the descendent tendency means a movement away from the sensor. Average linear LOS displacement rate (VL) is indicated for each PS; the purple line represents the linear deformation.
Sarychikhina O, David Gomez Palacios D, Delgado Argote L.A. and Gonzalez-Ortega J.A. (2020). Application of satellite SAR interferometry for the detection and monitoring of landslides along the Tijuana - Ensenada Scenic Highway, Baja California, Mexico. J. S. Am. Earth Sci. doi: 10.1016/j.jsames.2020.103030
Interseismic Velocity Field and Seismic Moment Release in Northern Baja California, Mexico
We have analyzed all available continuous and campaign GPS data from northern Baja California, Mexico, covering the period 1993.1-2010.1, in order to obtain a consistent interseismic velocity field to derive a continuous strain rate field. The analysis shows concentrations of high strain-rate along the Imperial/Cerro Prieto Fault system extending from the Salton Sea to the Gulf of California, with strike-slip faulting consistent with principal strain axes direction within the area of largest historical and instrumental seismic release.
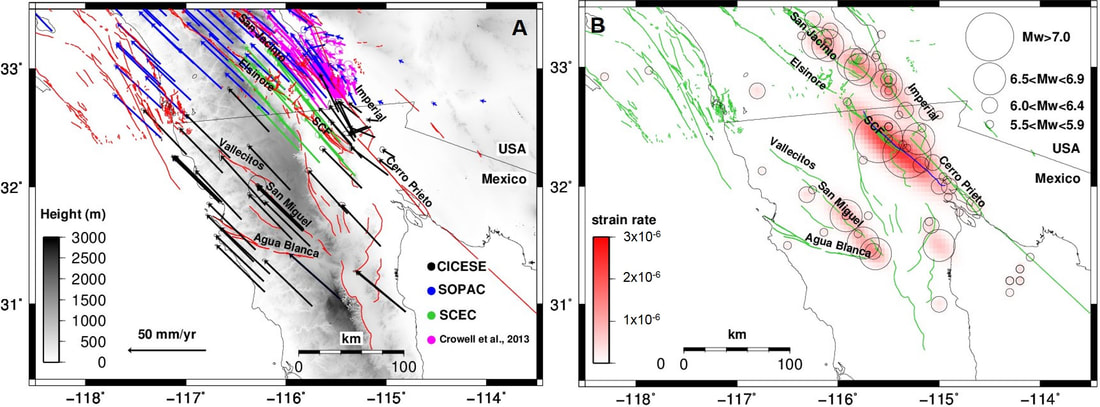
Figure. A: Crustal velocity field of velocity data in northern Baja California derived from 1993.1-2010.1 GPS observations in Stable North America Reference Frame. Blue arrows: velocity provided by SOPAC; magenta arrows: velocity from Crowell et al., 2013; green arrows: velocity from SCEC Crustal Motion Map version 4. Black vectors are GPS velocities from this study. B: Seismicity distribution of historic and instrumental earthquake catalog for Mw ≥ 5.5 since 1891 to 2017. Superimposed is the calculated seismic strain rate. The blue line denotes the El Mayor-Cucapah 2010 earthquake fault trace.
We translated the strain rate into geodetic moment accumulation rate to evaluate the potential of seismic activity of the region and compare with the actual seismic release of historical and instrumental earthquake catalog. Comparison of regional moment accumulation rate based on geodesy (6.3±1.3x10¹⁸ Nm/yr) to the corresponding moment release rate by earthquakes (2.7±0.8x10¹⁸ Nm/yr) highlights a moment rate deficit equivalent to a Mw 7.5-7.8 earthquake. As part of this accumulated moment was released by the recent 2010, Mw7.2 El Mayor-Cucapah earthquake, these results can provide input constraints on earthquake forecasts for the northern Baja California fault System.
We translated the strain rate into geodetic moment accumulation rate to evaluate the potential of seismic activity of the region and compare with the actual seismic release of historical and instrumental earthquake catalog. Comparison of regional moment accumulation rate based on geodesy (6.3±1.3x10¹⁸ Nm/yr) to the corresponding moment release rate by earthquakes (2.7±0.8x10¹⁸ Nm/yr) highlights a moment rate deficit equivalent to a Mw 7.5-7.8 earthquake. As part of this accumulated moment was released by the recent 2010, Mw7.2 El Mayor-Cucapah earthquake, these results can provide input constraints on earthquake forecasts for the northern Baja California fault System.
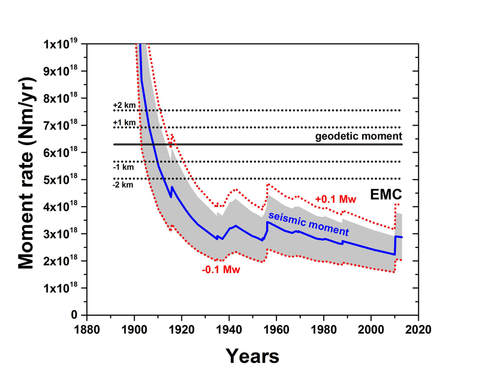
Figure. Rate of seismic moment release calculated in progressively increasing time windows. The blue line correspond to earthquake data catalog with 30% of Mo uncertainty in gray area. The red dashed lines includes total ±0.1Mw bias in earthquake catalog. The black line is the geodetic moment estimation, and the black dashed lines are the uncertainty considering a seismogenic depth H=10±1,2 km. EMC: El Mayor-Cucapah Mw 7.2 earthquake.
Gonzalez‐Ortega, J.A., Gonzalez‐Garcia, J.J., and Sandwell D.T. (2018). Interseismic Velocity Field and Seismic Moment Release in Northern Baja California, Mexico. Seismol. Res. Let. doi:10.1785/0220170133
Gonzalez‐Ortega, J.A., Gonzalez‐Garcia, J.J., and Sandwell D.T. (2018). Interseismic Velocity Field and Seismic Moment Release in Northern Baja California, Mexico. Seismol. Res. Let. doi:10.1785/0220170133
Tectonic and Anthropogenic Deformation at the Cerro Prieto Geothermal Step-over Revealed by Sentinel-1 InSAR
Here we investigate the use of frequent, short temporal baseline interferograms offered by the new Sentinel-1A satellite to recover two components of deformation time series across the Imperial and the Cerro Prieto Faults in northern Baja California, Mexico. By constructing InSAR time series using a coherence-based SBAS method with atmospheric corrections by means of common-point stacking, we found that the maximum subsidence rate of 160 mm/yr, due to extraction of geothermal fluids and heat, dominates the ~40 mm/yr deformation across the proximal ends of the Imperial and the Cerro Prieto Faults.
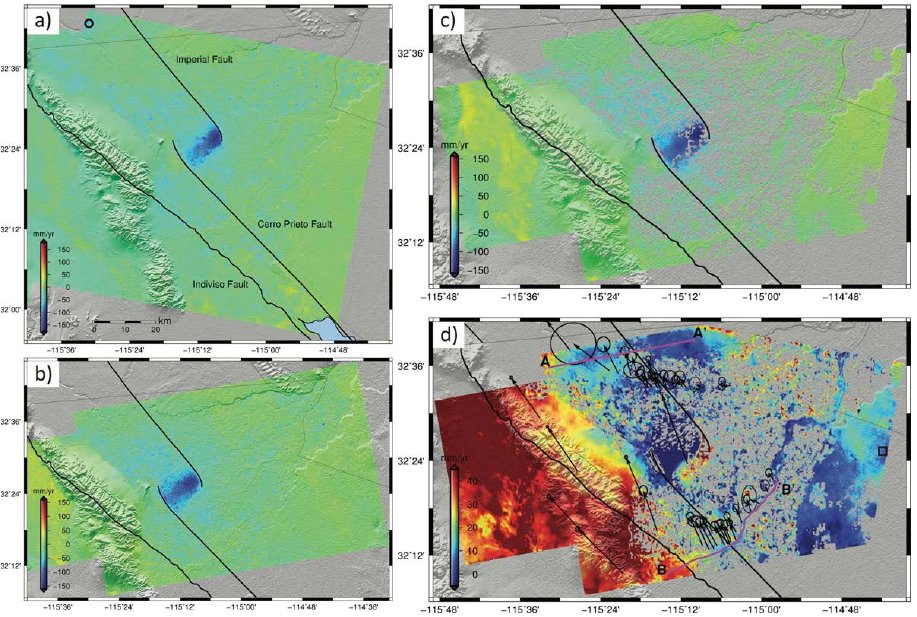
Figure. a) is the line-of-sight (LOS) velocity map for track 173. b) is the LOS velocity map for track 166. c) and d) are the decomposed vertical velocity and fault parallel velocity, assuming the average fault azimuth to be N36.5°W. A 0.15 coherence threshold was used to mask the data projected. The black lines are the faults and black arrows are GPS survey mode data in North America fixed reference frame with circles denoting the uncertainty. The black circle in a) is the location of the Heber geothermal field and the black square in d) is the location we pinned down to zero in the SBAS processing.
We demonstrate a pure geometric algorithm for InSAR processing of TOPS data from the Sentinel-1A satellite, common-point stacking for error estimation, and coherence based SBAS to ascending (42) and descending (34) acquisitions in the region surrounding the Cerro Prieto Geothermal Field (CPGF). The error estimation technique works well due to the small baselines,
short time-span, and regular cadence of Sentinel-1A satellite. The improved coverage facilitates the combination ascending and descending LOS mean velocity grids into vertical and fault-parallel grids. The fault-parallel estimates show adequate agreement with two dense GPS profiles across the Imperial and Cerro Prieto faults.
This new analysis provides refined estimates of three important crustal deformation signals in the region:
1) We produce the first complete map of the area of high subsidence rate at the step-over between the Imperial and Cerro Prieto faults. The estimated subsidence rate is higher now (~160 mm/yr) than in the past (120-140 mm/yr).
2) We show that the Imperial fault does not accommodate the full 40 mm/yr of strike slip motion across the region and there is significant deformation across unmapped faults in the western Mexicali valley and further to the west.
3) We observe that currently the Cerro Prieto fault accommodates less than half of the full plate motion. Our analysis shows significant motion across the Indiviso fault and faults further to the west.
Xu, X., D. T. Sandwell, E. Tymofyeyeva, A. Gonzalez-Ortega, and X. Tong (2017), Tectonic and anthropogenic deformation at the Cerro Prieto geothermal step-over revealed by Sentinel-1 InSAR. IEEE Trans. Geos. Rem. Sen. 99(1-9). doi:10.1109/TGRS.2017.2704593.
Fault Geometry Inversion and Slip Distribution of the 2010 Mw 7.2 El Mayor-Cucapah Earthquake from Geodetic Data
Here we use geodetic measurements including near- to far-field GPS, InSAR (Interferometric Synthetic Aperture Radar), and sub-pixel offset measurements of radar and optical images to characterize the fault slip during the EMC event. We use dislocation inversion methods and determine an optimal nine-segment fault geometry.
With systematic perturbation of the fault dip angles, randomly removing one geodetic data constraint, or different data combinations, we are able to explore the robustness of the inferred slip distribution along fault strike and depth. The model-fitting residuals imply contributions of early postseismic deformation to the InSAR measurements as well as lateral heterogeneity in the crustal elastic structure between the Peninsular Ranges and the Salton Trough.
With systematic perturbation of the fault dip angles, randomly removing one geodetic data constraint, or different data combinations, we are able to explore the robustness of the inferred slip distribution along fault strike and depth. The model-fitting residuals imply contributions of early postseismic deformation to the InSAR measurements as well as lateral heterogeneity in the crustal elastic structure between the Peninsular Ranges and the Salton Trough.
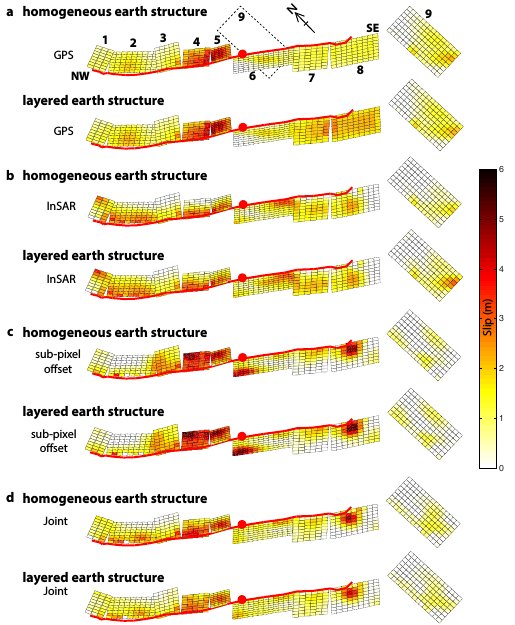
Figure. Comparison of (a) GPS, (b) InSAR, (c) sub-pixel offset, and (d) joint inversion using homogeneous or layered Earth structure. The red circle represents the earthquake epicenter and the red line the surface rupture.
Given geodetic data spatial sampling and the uncertainty of each dataset, the slip model has higher resolution at shallower depth, and fails to resolve distinct slip patches at the bottom of the model fault planes. We find that considering different Earth structures results in a 60% difference in the amount of inferred deep slip. Including near-field geodetic data such as InSAR and sub-pixel offset of SAR images, and finer sub-fault patch size, we find peak slip at the shallowest depth (0-2 km) for the EMC event that contradicts the proposed shallow slip deficit found for the 2003 Bam earthquake and some previous EMC studies.
This result implies peak slip depth can be influenced by the choice of data constraints and fault model discretization and smoothing, which is independent of fault zone properties and tectonic loading, in addition to true variations in fault slip.
Huang, M.-H., E. J. Fielding, H. Dickinson, J. Sun, J. Alejandro Gonzalez-Ortega, A. M. Freed, and R. Bürgmann (2016), Fault Geometry Inversion and Slip Distribution of the 2010 Mw 7.2 El Mayor-Cucapah Earthquake from Geodetic Data, J. Geophys. Res. Solid Earth, 121, doi:10.1002/2016JB012858.
Assembly of a large earthquake from a complex fault system: surface rupture kinematics of the April 4, 2010 El Mayor-Cucapah Mw7.2 earthquake
The 4 April 2010 moment magnitude (Mw) 7.2 El Mayor–Cucapah earthquake revealed the existence of a previously unidentified fault system in Mexico that extends ~120 km from the northern tip of the Gulf of California to the U.S.–Mexico border.
Rupture propagated bilaterally through three distinct kinematic and geomorphic domains: 1) Southeast of the epicenter, a broad region of distributed fracturing, liquefaction, and discontinuous fault rupture was controlled by a buried, southwest-dipping, dextral-normal fault system that extends ~53 km across the southern Colorado River delta. 2) Northwest of the epicenter, the sense of vertical slip reverses as rupture propagated through multiple strands of an imbricate stack of east-dipping dextral-normal faults that extend ~55 km through the Sierra Cucapah. Some coseismic slip (10–30 cm) was partitioned onto the west-dipping Laguna Salada fault. 3) In the northernmost domain, rupture terminates on a series of several north-northeast–striking cross-faults with minor offset (<8 cm) that cut uplifted and folded sediments of the northern Colorado River delta in the Yuha Desert.
Rupture propagated bilaterally through three distinct kinematic and geomorphic domains: 1) Southeast of the epicenter, a broad region of distributed fracturing, liquefaction, and discontinuous fault rupture was controlled by a buried, southwest-dipping, dextral-normal fault system that extends ~53 km across the southern Colorado River delta. 2) Northwest of the epicenter, the sense of vertical slip reverses as rupture propagated through multiple strands of an imbricate stack of east-dipping dextral-normal faults that extend ~55 km through the Sierra Cucapah. Some coseismic slip (10–30 cm) was partitioned onto the west-dipping Laguna Salada fault. 3) In the northernmost domain, rupture terminates on a series of several north-northeast–striking cross-faults with minor offset (<8 cm) that cut uplifted and folded sediments of the northern Colorado River delta in the Yuha Desert.
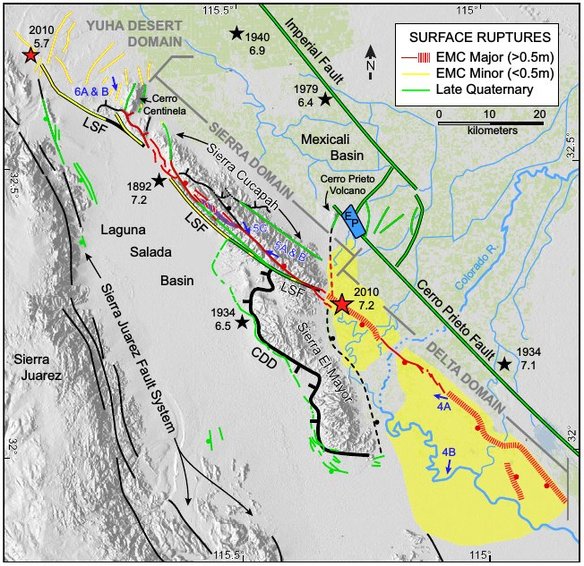
Figure. Map showing the main shock epicenter of El Mayor–Cucapah (EMC) (red star), progenitor fault of this earthquake sequence (red dotted line north of epicenter), and three macroscopic domains of the surface rupture, which include Yuha Desert, Sierra, and Delta domains. The yellow shaded envelopes in the Delta domain demarcate the approximate limits of distributed liquefaction and surface failure. In the Delta domain, laterally continuous coseismic surface displacements were only observed by remote sensing methods including synthetic aperture radar interferometry (thick red hachures) and pre-event and post-event lidar (light detection and ranging) elevation differences (solid red lines). Also shown are epicenter locations of historical earthquakes (black stars) and older rupture traces (greenlines).
The Mw 7.2 EMC of 4 April 2010 produced the most complex rupture ever documented on the Pacific–North American plate margin. Mapping and structural analysis of discrete surface rupture and distributed ground failure is consistent with rupture initiating on a north-striking fault and then propagating bilaterally to the northwest and southeast. Slip cascaded through a network of at least seven distinct master faults, which have a large range of diversity in geometry and kinematics. Low-angle detachments control large segments of the surface rupture and played an important role in transferring slip through the fault network.
Fletcher J., Teran J.O., Rockwell T. J., Oskin M., Hudnut K.W., Mueller K.J., Spelz R. M., Akciz S.O., Masana E., Faneros G., Morellan A., Stock J., Elliott A., Gold P., Liu-Zeng J., Gonzalez-Ortega J.A., Lynch D., Hinojosa-Corona A., Gonzalez-Garcia J (2014). Assembly of a large earthquake from a complex fault system: surface rupture kinematics of the April 4, 2010 El Mayor-Cucapah Mw7.2 earthquake. Geosphere. 10(3). 2014. doi:10.1130/GES00933.1.
El Mayor-Cucapah (Mw 7.2) earthquake:Early near-field postseismic deformation from InSAR and GPS observations
El Mayor-Cucapah earthquake occurred on 4 April 2010 in northeastern Baja California, Mexico just south of the U.S.-Mexico border. The earthquake ruptured several previously mapped faults,as well as some unidentified ones, including the Pescadores, Borrego, Paso Inferior and Paso Superior faults in the Sierra Cucapah, and the Indiviso fault in the Mexicali Valley and Colorado
River Delta.
We conducted several GPS campaign surveys within days after the earthquake, allowing us to capture the very early postseismic transient motions. The GPS time series indicate a gradual decay in postseismic velocities with characteristic time scales of ~70 days assuming exponential. We also analyzed InSAR data from the Envisat and ALOS satellites. The main deformation features seen in the line-of-sight displacement maps indicate subsidence concentrated in the southern and northern parts of the main rupture, in particular at the Indiviso fault, at the Laguna Salada basin, and at the Paso Superior fault.
We show that the near-field GPS and InSAR observations over a time period of 5 months after the earthquake can be explained by a combination of afterslip, fault zone contraction, and a possible minor contribution of poroelastic rebound. In the far-field (>25 km from the earthquake rupture) the afterslip model tends to underpredict surface displacements, suggesting a contribution from viscoelastic relaxation in the ductile substrate.
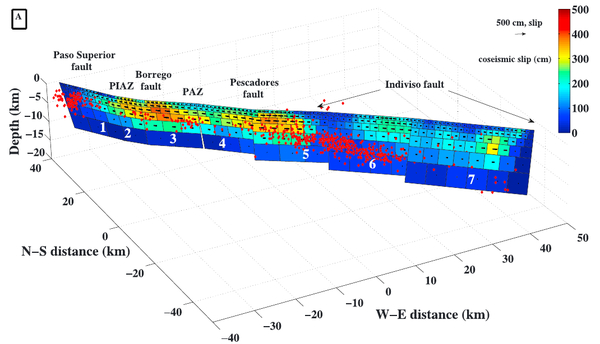
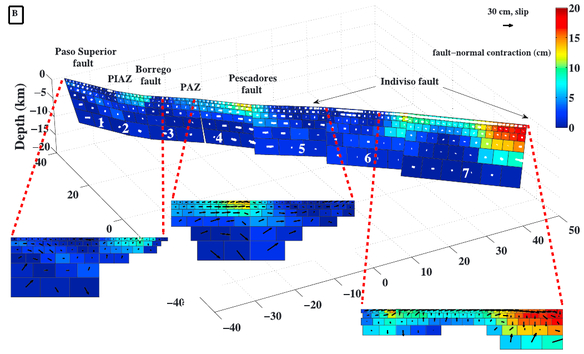
Figure. (A) Finite coseismic slip model. Colors denote the amplitude of slip. Red circles denote aftershocks during the first 5 months. (B) Best fitting postseismic model. Colors denote the amplitude of fault-normal displacements (contraction is positive), and arrows denote the distribution of afterslip. After slip model indicates that most of the afterslip occurred on the periphery of the main coseismic slip patches. Aftershocks occurred preferentially in between the areas of high coseismic slip and afterslip, possibly delineating a boundary between the velocity-weakening and velocity-strengthening parts of the fault.
Gonzalez-Ortega, A., Y. Fialko, D. Sandwell, F. Alejandro Nava-Pichardo, J. Fletcher, J. Gonzalez-Garcia, B. Lipovsky, M. Floyd, and G. Funning (2014), El Mayor-Cucapah (Mw 7.2) earthquake:Early near-field postseismic deformation from InSAR and GPS observations, J. Geophys. Res. Solid Earth, 119, doi:10.1002/2013JB010193.
Gonzalez-Ortega, A., Y. Fialko, D. Sandwell, F. Alejandro Nava-Pichardo, J. Fletcher, J. Gonzalez-Garcia, B. Lipovsky, M. Floyd, and G. Funning (2014), El Mayor-Cucapah (Mw 7.2) earthquake:Early near-field postseismic deformation from InSAR and GPS observations, J. Geophys. Res. Solid Earth, 119, doi:10.1002/2013JB010193.